MTA Survey Finds Most Riders Happy
- Share via
Most riders are satisfied with their bus service, but rail passengers seem even happier, MTA officials said Monday.
A survey of 43,000 weekday passengers conducted from June to December 2001 by the Metropolitan Transportation Authority found that 56% ranked their travel on buses as “good” or “very good,” compared to 78% who gave subways or light rail the same high ratings. Overall, 69% of those polled believed that bus service was improving.
The survey, the first since 1996 and the largest ever conducted by the MTA, also found that Latinos use public transportation more than any other ethnic group, constituting 58% of bus riders and 41% of rail passengers.
Bus riders also tended to be female, poorer and less educated than rail passengers, the survey showed. The median family income for bus riders is $13,000, compared to $22,000 for rail riders. Nearly one-quarter of rail riders reported an annual family income of more than $50,000, while one-third of bus riders had household incomes of less than $7,500 a year. Results of the survey will be used for the MTA’s long-range planning and service scheduling, said Jesse Simon, planning manager for the transit agency.
Rider advocates say service is getting better, but much more work remains.
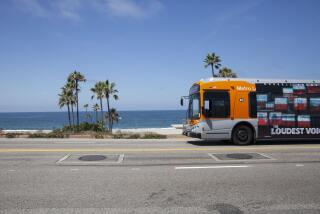
“People seem happier now,” said Bart Reed, executive director of the Transit Coalition, a group based in Sylmar. He added that since the MTA began replacing its old diesel fleet with new, natural-gas-powered coaches, bus travel has become more pleasant.
Eric Mann, past co-chairman of the Bus Riders Union and current member of the group’s planning committee, said too many buses are still overcrowded and running behind schedule.
“There’s been some improvement, but it’s not good enough,” Mann said. “I’m still late for work, I still can’t get a seat.”
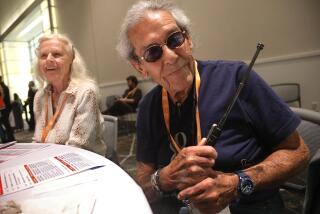
To conduct the survey, MTA employees hopped onto buses and trains selected in random clusters throughout Los Angeles County. They handed every passenger a one-page questionnaire with a Spanish version on the reverse side.
Of the roughly 320,000 questionnaires distributed on weekdays, the MTA received 31,000 responses from bus riders and 12,000 from rail passengers. The margin of error, Simon said, is plus or minus 1%. A follow-up telephone survey of 2,500 bus and 1,000 rail passengers was also conducted.
MTA bus drivers were rated as “good” or “very good” for their knowledge of routes by 81% of passengers. Fewer riders--58%--gave the drivers the same rankings for courteousness.
The greatest sources of rider unhappiness stemmed from service frequency and punctuality. About one-quarter of riders thought that frequency and punctuality were “poor” or “very poor” and one-third rated them as “fair.”
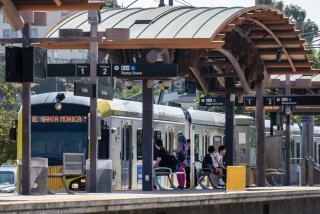
Virtually across the board, respondents were more satisfied with rail than bus service. A greater percentage of riders found rail to be clean, on-time and less crowded.
The survey also found that the typical rider walked to bus or train stops and rode transit for about an hour. Two-thirds of riders transferred to another bus or train, and more than 70% rode five or more days per week. Bus riders are also more transit-dependent, with about 75% saying they don’t have access to a car, while 50% of rail riders do.
In 1996, the MTA asked riders similar questions but many of those responses cannot be compared because of differences in wording, Simon said.
For example, the 1996 survey showed 65% of riders believed bus service is “good” or “very good.” But respondents could choose only from four categories that also included “fair” and “poor.
This year’s riders were given a fifth category--”very poor”--to consider.
More to Read
Sign up for Essential California
The most important California stories and recommendations in your inbox every morning.
You may occasionally receive promotional content from the Los Angeles Times.


